
Filters and the four tiles
Activity is a live feed — it refreshes every ten seconds, and the pulsing dot beside the title means what you are looking at is current.
The tiles
Over the selected window: Requests, Blocked, Top models (top three) and Top MCP servers (top three). Each shows "No data yet" rather than a zero when there is genuinely nothing, so you can tell "quiet" from "broken".
Top MCP servers is the one people find most surprising. It is a ranking of what your AI assistants are actually reaching for.
The filters
- Time window — last 24 hours, 7 days or 30 days.
- Outcome — all, OK, blocked, or upstream error.
- Event type — all, requests, or risk events.
- Developer — a specific person. The list includes admins as well as developers, because admins can have governed tools too.
- Model — free text, so
opusnarrows to everything with that in the model name.
Combinations worth knowing
- Blocked, last 7 days — the review you should do weekly. It tells you whether your policy is doing something useful or just being annoying.
- Risk events, last 30 days — what the detectors are finding, independently of whether anything was stopped.
- One developer, 24 hours — what you look at when somebody says "it stopped working".
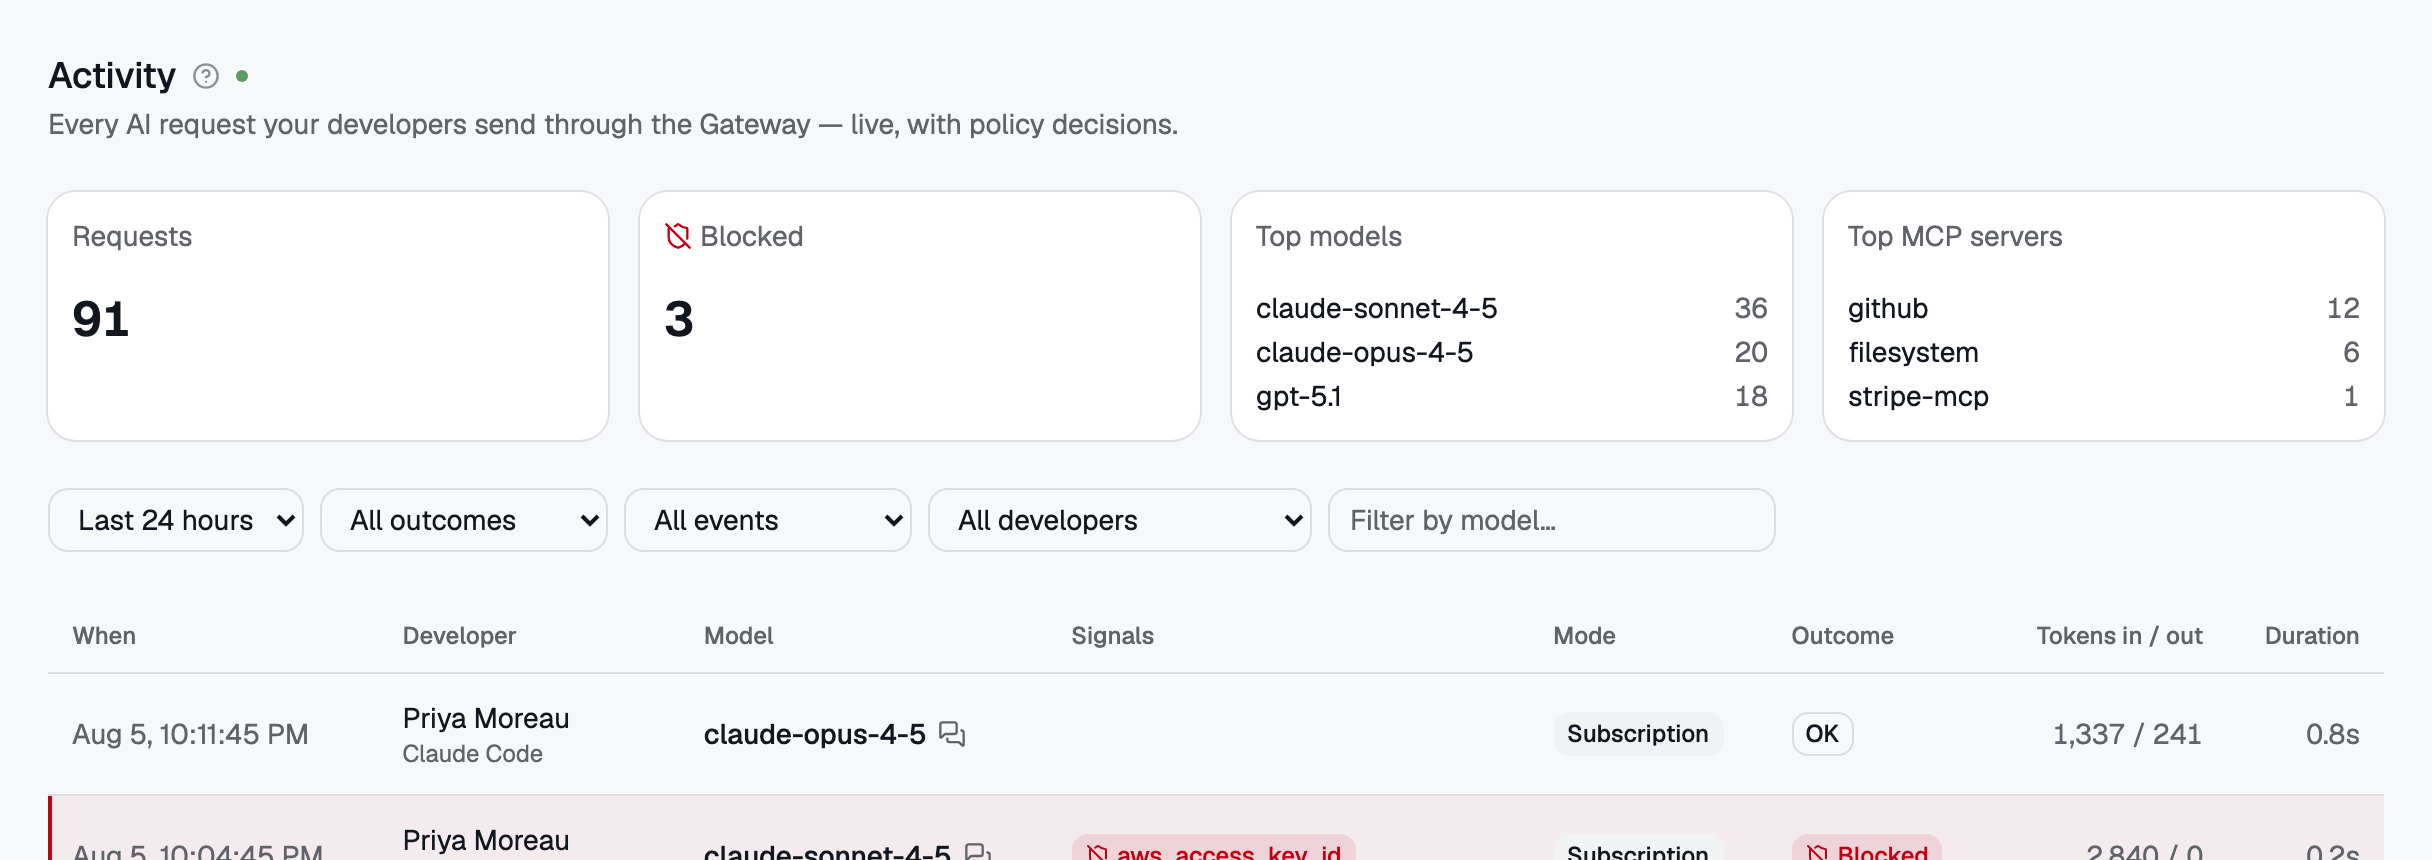 The four tiles and the filter row. "No data yet" rather than a zero, so quiet reads differently from broken.
No comments to display
No comments to display